September 13, 2022
What is dashboard reporting?
Dashboard reporting is a way to quickly and easily see how your business is performing. Dashboards provide an overview of key metrics and can be customized to show the information that is most important to you. With dashboard reporting, you can track your progress over time and see where you need to make improvements.
Business dashboards are an essential tool for any business owner, manager, or entrepreneur. They help you to understand your data and make better decisions about your business. If you don't have a dashboard, you're missing out on a powerful tool that can help you to grow your business.
There are many different types of dashboards, but they all have one thing in common: they make it easy to see the most important information at a glance. Dashboards can be simple or complex, but they all serve the same purpose: to help you understand your data and make better decisions.
10 Benefits of dashboard reporting
The benefits of dashboard reporting are many. In this article, we will explore 10 of the key advantages that make dashboards such an important tool for businesses today.
1. Improved decision making-
With all of the information that a dashboard can provide at a glance, business leaders can make more informed decisions about where to allocate resources and make changes.
2. Increased efficiency-
A well-designed dashboard will help users quickly find the information they need without having to search through multiple reports or data sets.
3. Improved communication-
Dashboards can be a great way to communicate information to colleagues or clients in a clear and concise manner.
4. Greater insight-
By displaying data in an easy-to-understand format, dashboards can help users gain new insights into their business or industry.
5. Better customer service-
By providing employees with quick access to customer data, dashboards can help improve the quality of customer service.
6. Enhanced security-
Dashboards can help organizations keep track of critical data and ensure that only authorized users have access to it.
7.Improved planning-
Dashboards can be used to track trends and historical data, which can help organizations plan for future events or changes.
8. Reduced costs-
Dashboards can help organizations save money by reducing the need for printed reports or manual data entry.
9. Increased revenue-
By providing employees with quick access to sales data, dashboards can help improve sales productivity and increase revenue.
10. Improved compliance-
Dashboards can help organizations track compliance with internal policies or external regulations.
Dashboards provide businesses with a wealth of advantages that can help them to improve their performance and make better decisions. If you are not using dashboards yet, we encourage you to consider doing so. You may be surprised at just how helpful they can be.
10 ways to choose the best dashboard reporting management for your business
As a business owner, you know that data is important. After all, it's what helps you make decisions about your products, services, and customers. But what good is all of that data if you can't make sense of it? That's where dashboard reporting comes in.
Dashboard reporting is a way to visually represent your data in a way that is easy to understand. It can help you see trends, identify areas of opportunity, and make better decisions for your business.
But with so many dashboard reporting tools out there, how do you know which one is right for your business? Here are 10 ways to choose the best dashboard reporting tool for your needs:
1. Consider your needs:
What do you hope to get out of a dashboard reporting tool? Do you need something that is easy to use and understand, or are you looking for something more robust with more features?
2. Look at the features:
Once you know what you need, take a look at the different features of each dashboard reporting tool. Some important features to consider include:
- Ease of use
- Data visualization options
- Reporting and analysis capabilities
- Integration with other software
3. Compare pricing:
Of course, you'll also want to consider pricing when choosing a dashboard reporting tool. Be sure to compare the cost of the tool itself as well as any monthly or annual subscription fees.
4. Check out the reviews:
Once you've narrowed down your choices, take some time to read online reviews of each dashboard reporting tool. See what others are saying about the features, ease of use, customer support, and overall satisfaction.
5. Test it out:
Once you've selected a few final contenders, try them out for yourself. Many dashboard reporting tools offer free trials, so take advantage of that and see how each tool works in real-world scenarios.
6. Get input from others:
If you have employees or other team members who will be using the dashboard reporting tool, get their input on which one they prefer. They may have different needs or preferences than you do, so their opinion can be helpful in making a final decision.
7. Consider your budget:
Dashboard reporting tools can vary widely in price, so be sure to consider your budget when making your selection. There's no need to overspend on a tool that has more features than you'll ever use.
8. Compare features and pricing:
Once you've considered all of the above factors, it's time to compare the features and pricing of each marketing dashboard reporting tool side by side. This will help you see which one offers the best value for your needs.
9. Choose the right tool for your business:
Not all dashboard reporting tools are created equal, so be sure to choose the one that is best suited for your particular business needs.
10. Get started with dashboard reporting:
Now that you've selected the perfect dashboard reporting tool for your business, it's time to get started using it to make better decisions for your company.
Once you've considered all of these factors, you'll be well on your way to finding the best dashboard reporting tool for your business. With the right tool, you'll be able to make better decisions, improve your bottom line, and keep your business running smoothly.
Types of dashboards
There are several key types of dashboards that can be used to visualize data and track performance. The most common dashboard types include:
1. Executive dashboards:
These dashboards typically provide high-level overviews of organizational performance and are used by senior leaders to make strategic decisions.
2. Operational dashboards:
These business intelligence dashboard are used to track day-to-day performance and identify areas of improvement.
3. Analytical dashboards:
These analytics dashboard provide detailed insights into data and can be used for things like predictive analytics, data analytics and trend data analysis dashboard reports.
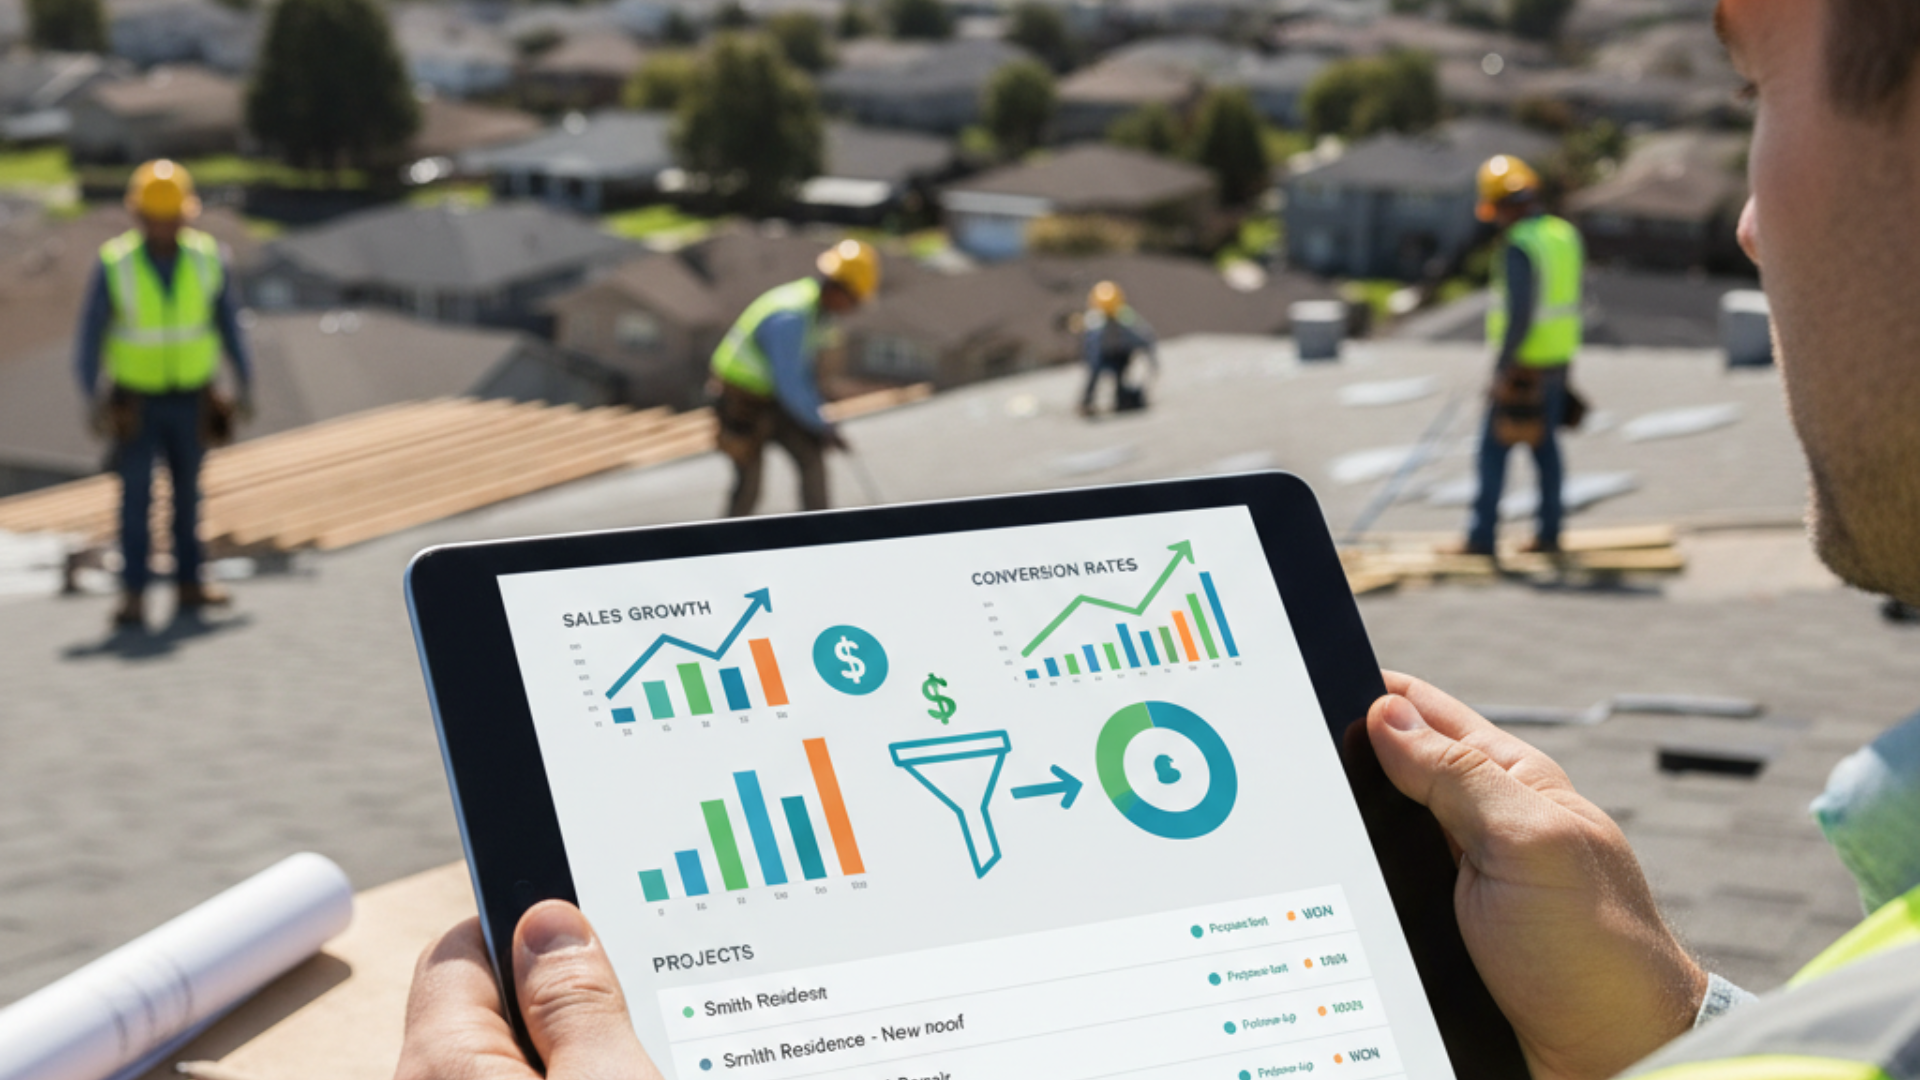
4. Sales dashboards:
These dashboards track sales data and performance, and can be used to measure things like revenue, conversion rates, and pipeline health.
5. Marketing dashboard:
These dashboards track marketing performance and can be used to measure things like leads, marketing efforts, key performance indicators relevant metrics, data analysts software solutions, website traffic, and social media engagement.
6. Strategic dashboards:
Strategic dashboards are used by executives to make high-level decisions about the direction of the company. They contain KPIs that measure the overall health of the business and help executives see how the company is performing against its competitors.
7. Human resources dashboards:
These dashboards track HR data and performance, and can be used to measure things like employee turnover, engagement levels, and training needs.
Sunbase Dashboard Reporting Management features include:
1. Multi-view metrics dashboards:
Gather, manage, and make accessible at all times important prospect and customer information.
2. More than fifty report templates:
Organize events and meetings quickly, and filter calendar displays by user, region, or appointment type.
3. Custom report builder:
Create unique reports based on the key data metrics that are crucial to the success of your business.
4. Key performance indicator leader board:
Monitor lead sources and key performance metrics for marketing campaigns to understand what converts most effectively.
Conclusion
Dashboard reporting provides business executives with a snapshot of their company’s performance. It allows them to see areas that need improvement and take corrective action quickly. Additionally, dashboard reporting can help identify trends in your data so you can adjust your strategy accordingly. By providing concise and accurate information, dashboard reports give business leaders the tools they need to make sound decisions for the future of their company. Have you used dashboard reporting in your own business? What benefits have you seen?
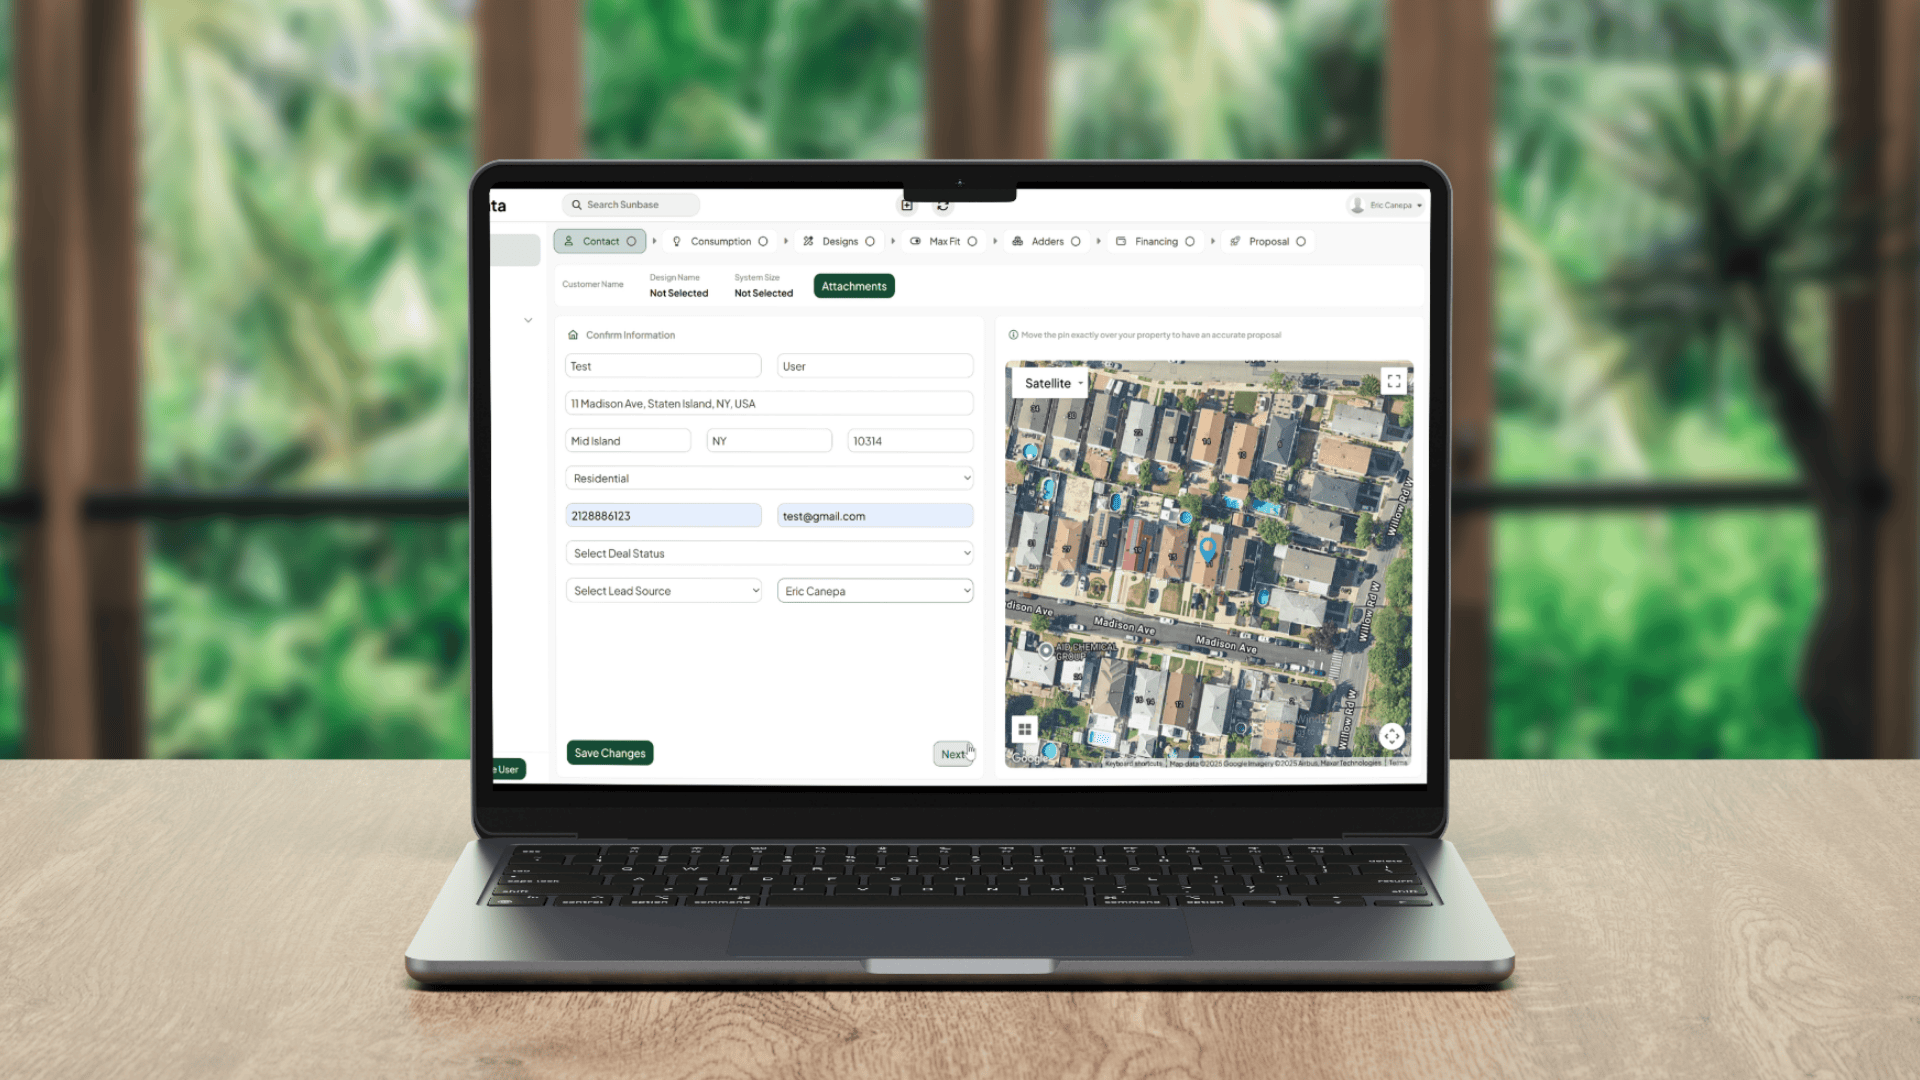
About Sunbase
Sunbase helps solar companies succeed through a suite of Solar CRM tools like Solar Lead Management Software, Solar Proposal Software, etc.! To book your free demo or an appointment, contact us here.
One Platform. Zero Chaos. Run Your Entire Business in One Place.
Sunbase replaces your CRM, proposals, scheduling, job tracking, and reporting tools — all inside one clean, connected platform.
About Sunbase
The All-In-One Platform to Run Your Entire Business
Sunbase helps you organize operations, streamline daily workflows, and manage everything - from first customer contact to final project deliver- in one connected system.
Our Mission
- Organize your business.
- Optimize your workflow.
- Automate what slows you down.
Why Businesses Choose Sunbase
One Connected Workflow
Replace scattered tools and manual processes with a single platform that brings together your team, tasks, customers, jobs, and performance data.
🌎 Global Presence
Serving the United States, Canada, India, LATAM, Australia, and 10+ international markets.
👥 11,000+ Users
Trusted by contractors, installers, project managers, sales teams, and field technicians.
🏗️ Built for All Sizes
From small contracting teams to fast-growing enterprises, Sunbase adapts to your workflow.
Useful Links For You


Stop Managing Your Business Manually. Automate It.
Sunbase automates workflows, reduces mistakes, and helps your team get more done - without hiring extra staff or juggling multiple tools.