
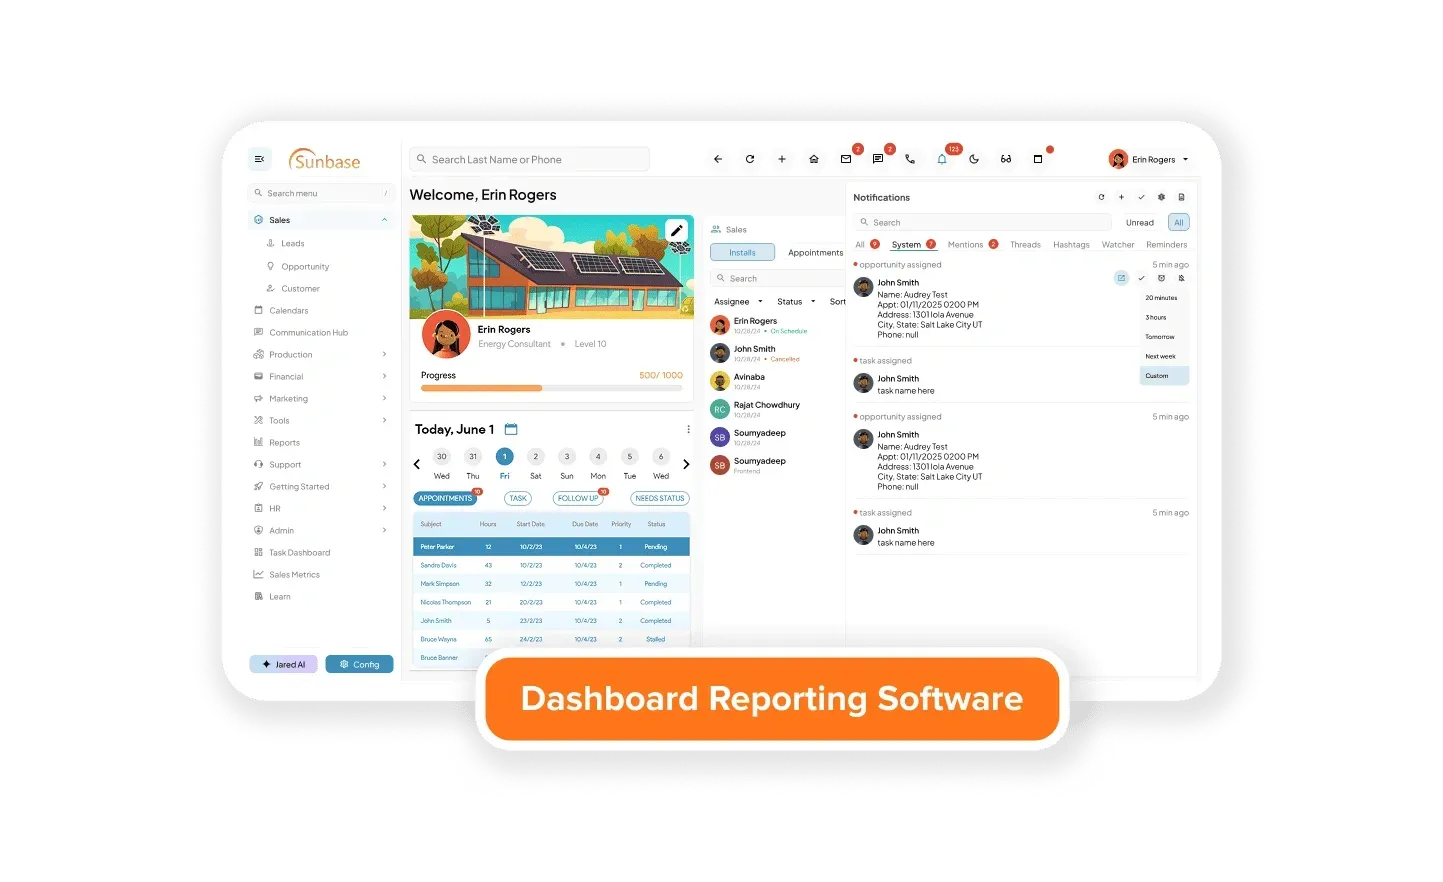
Dashboard Reporting Software
Streamline decision-making, enhance collaboration, and drive performance with our advanced
Dashboard Reporting Tools
Empower Your Business with Advanced Dashboard Reporting Tools
Customizable Dashboards
Tailor-Made Visualizations
Create personalized dashboards that cater to specific roles and departments within your organization. Our intuitive drag-and-drop interface allows users to customize layouts effortlessly. Choose from a variety of visualization options, including charts, graphs, and tables, to present data in the most impactful way.
Real-Time Data Integration
Instant Data Updates
Connect seamlessly with multiple data sources such as databases, CRM systems, and APIs. Our software ensures real-time updates and synchronization, providing users with the latest information at their fingertips. Stay agile and responsive with data-driven decision-making capabilities.
Interactive Data Visualizations
Dynamic Insights
Gain deeper insights with interactive data visualizations. Drill down into specific metrics and KPIs to uncover trends, outliers, and correlations. Utilize features like heat maps, trend lines, and geographical mapping to explore data dynamically and uncover actionable insights.
Advanced Analytics
Data-Driven Forecasting
Leverage predictive analytics to forecast future trends and behaviors based on historical data patterns. Our software incorporates data mining techniques and advanced statistical analysis to empower proactive decision-making.
Automated Reporting
Scheduled Insights
Streamline reporting processes with automated scheduling and distribution of reports. Customize report templates to fit your specific needs and automate recurring tasks. Receive email notifications for scheduled reports and empower your team with timely, actionable insights.
Mobile Access
On-the-Go Insights
Access dashboards and reports anytime, anywhere with our mobile-optimized platform. Enjoy responsive design and dedicated mobile apps that ensure seamless performance on smartphones and tablets. Stay informed with push notifications for critical updates.
Unlocking Strategic Insights with
Dashboard Reporting Software
Dashboard Reporting Software empowers decision-makers by consolidating complex data streams into clear, interactive dashboards. These tools not only facilitate real-time monitoring of key performance indicators (KPIs) but also provide predictive analytics to forecast trends and streamline decision-making processes.
From operational efficiency gains to enhanced collaboration and strategic performance monitoring, Dashboard Reporting Software offers a comprehensive toolkit for modern enterprises seeking to thrive in competitive markets. By leveraging actionable insights derived from robust data analysis, organizations can drive innovation, optimize resource allocation, and stay agile in response to evolving business dynamics.
Enhanced Decision-Making
Dashboard Reporting Software empowers organizations to make informed decisions by providing clear, real-time insights into key performance indicators (KPIs) and business metrics. With customizable dashboards and interactive visualizations, decision-makers can quickly analyze trends, identify opportunities, and mitigate risks, ensuring strategic alignment across departments and projects.
Improved Operational Efficiency
By centralizing data from multiple sources and automating reporting processes, Dashboard Reporting Software enhances operational efficiency. Teams can streamline workflows, reduce manual efforts in data collection and analysis, and focus on value-added tasks. Real-time data updates and predictive analytics further optimize resource allocation and operational planning, driving productivity and reducing costs.
Facilitated Collaboration
Foster collaboration and alignment across teams with Dashboard Reporting Software's shared insights and collaborative features. Teams can annotate, comment, and share dashboards securely, facilitating transparent communication and knowledge sharing. With customizable access controls and role-based permissions, stakeholders can access relevant data without compromising data security or confidentiality.
Strategic Performance Monitoring
Monitor organizational performance and track progress towards goals effectively with Dashboard Reporting Software. Dynamic visualizations and drill-down capabilities enable detailed performance analysis across departments and projects. Predictive analytics and trend forecasting empower proactive decision-making, allowing organizations to adapt strategies in response to changing market dynamics and business conditions.
Data-Driven
Insights
Gain actionable insights from complex datasets with Dashboard Reporting Software's advanced analytics capabilities. Machine learning algorithms and statistical analysis tools uncover hidden patterns, correlations, and trends within data, providing deeper understanding and predictive insights. By leveraging data-driven insights, organizations can optimize business processes, improve customer experiences, and capitalize on emerging opportunities.
Scalability and Flexibility
Scale your analytics capabilities and adapt to evolving business needs with Dashboard Reporting Software's scalable architecture and flexible deployment options. Whether deployed on-premises or in the cloud, the software accommodates growing data volumes and supports integration with existing IT infrastructure and third-party applications. Customizable dashboards and modular features ensure scalability without compromising performance or usability.